
Finding the Midrange of a Dataset
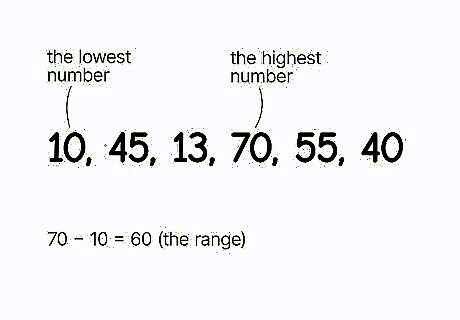
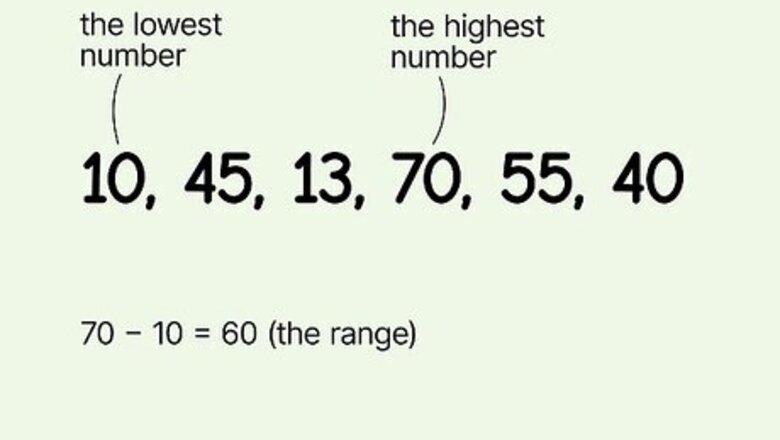
Determine the highest and lowest values in a set. The midrange is the average of the range of a dataset. The range is how far a dataset spans, so it starts with the lowest number and ends with the highest. For example, if you had the dataset 10, 45, 13, 70, 55, and 40, it ranges from 10 to 70, so 10 and 70 are the numbers you would work with. If you’re also calculating the range of a set, subtract the lowest number from the highest. So the range of the above set is 60.
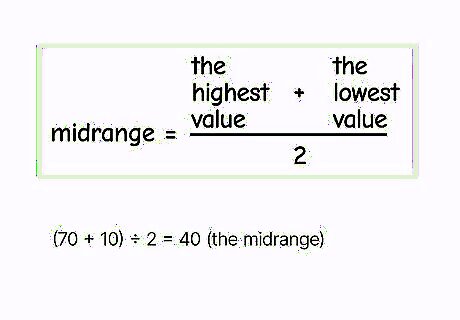
Take the average of the highest and lowest values. To get the midrange, add the lowest and highest values together and divide them by two. Midrange describes the central tendency across a spread of numbers and divides the range (or the boundaries of the set) in two. So, for the dataset 10, 45, 13, 70, 55, and 40, the midrange is 40.
Finding Midrange on Excel
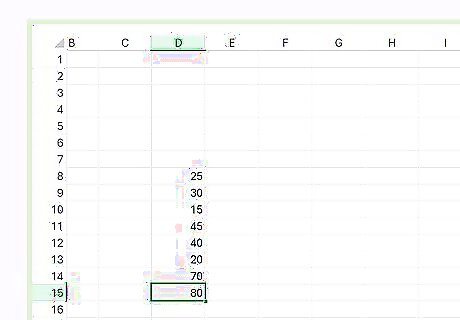
Input all your data in a column. Start by typing each value into a separate cell in one column or row on your sheet.
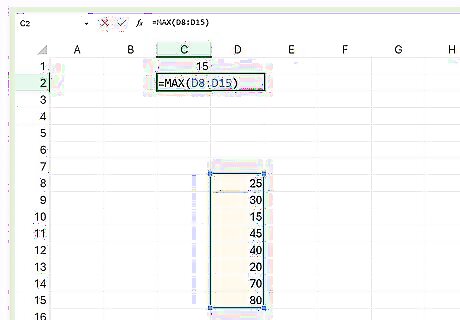
Find the highest and lowest values using the min and max commands. In another cell, put an equal sign and then write “max.” Highlight the column with your values and press “enter” to find the maximum. Do the same thing again in a new cell, this time with “min” instead of “max.” If your data was in cells D8 through D15, then your equations would end up looking like: =max(D8:D15) and =min(D8:D15). Highlighting the column automatically adds parentheses.
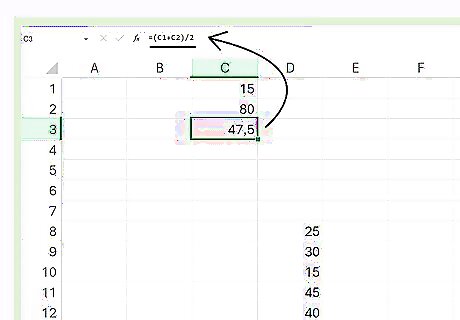
Add the highest and lowest values and use “/” to divide them by two. In another cell, add an equal sign and open parenthesis, then click on the cell where you found the minimum. Press “+”, then click on the cell where you found the maximum, and close the parenthesis. Type “/2,” then press enter to divide them by two. If your minimum value was in C1 and your maximum in C2, then the equation would look like =(C1+C2)/2. Alternatively, you can use the average of the maximum and minimum (which is the same thing as adding them together and dividing by 2) to find the midrange.
Midrange Versus Median
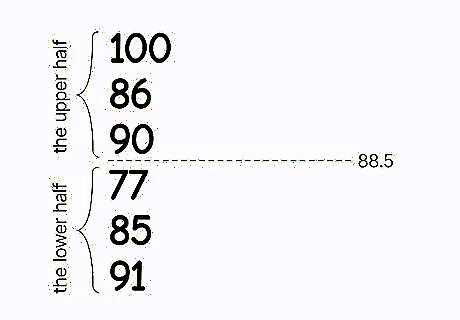
Use the midrange to find the upper and lower halves of a range. If you want to be able to divide the “field” in which the values fall, find the midrange. By dividing the range in half, you create two categories that data can fall into, the upper and lower half. For example, if a class had the test scores 100, 86, 90, 77, 85, and 91, the midrange would be 100 + 77 2 {\displaystyle {\frac {100+77}{2}}} {\displaystyle {\frac {100+77}{2}}} = 88.5. Now you can see who scored in the upper half of the range and who scored in the lower half. The more evenly spaced your range, the more meaningful the midpoint. If the scores had been 100, 86, 90, 77, 85, 91, and 10, for example, the midrange would be 55. Since there was an extreme outlier (10), the midrange is less helpful for contextualizing the other scores.
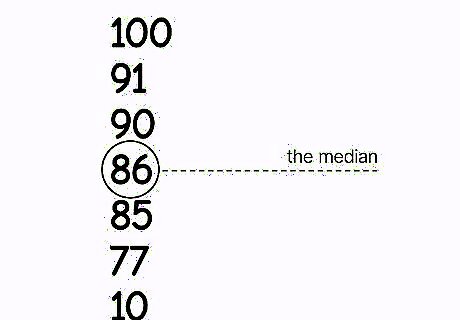
Use the median to find the middle value of a set. While the midrange marks a boundary within a set (the middle point), the median is the actual middle value, so it’s more helpful for sets with outliers. While the median may not be in the exact middle of a range, it can more accurately represent the middle of the data, since an equal amount of data points are on each side of it. Find the median by listing the numbers from lowest to highest and finding the middle value. If there are an even number of values, take the average of the middle two. Looking at the second set of test scores again—100, 86, 90, 77, 85, 91, 10—you can get a better idea of the middle of where people are scoring by taking the median instead of the midrange. In this case, the median is 86, while the midrange is 55. In the first set of data (that doesn’t have the outlier score “10”) the median and the midrange are almost exactly the same, 88 and 88.5.


Comments
0 comment