views
The abrogation of Article 370 on August 5, 2019 brought about complete integration of Jammu and Kashmir and Ladakh with the Union of India. One Nation, One Constitution was finally implemented. Along with all the central acts, the Delimitation Act of 2002 also came into force.
Now, with the implementation of the Delimitation Act 2002, the Delimitation Commission has started its work in Jammu and Kashmir. On one hand there is hope and expectation, but on the other hand, there are very grave concerns pertaining to delimitation. Delimitation is very important exercise for the people of Union Territory of Jammu and Kashmir. Considering the wrongs done in the past, the Delimitation Commission has a challenging and herculean task at hand. It is important that the exercise of delimitation is based on correct data in terms of population, facilities of communication, connectivity, geographical features and other such relevant factors in each region of the Union Territory of Jammu and Kashmir.
The major concern is that nearly 70 per cent of the weightage for the delimitation parameters has been placed on the 2011 Census data. A close scrutiny of the data points at many irregularities with respect to population, voter numbers, area measurements of districts etc. that have gone unnoticed for many years. The discrepancies point to not just a Jammu Vs Kashmir anomaly but also misrepresentation of data in Kashmir valley. There is an indication of a clear intent to keep the discourse Srinagar-centric. The following exercise trains the spotlight on the population anomalies in the 2011 Census data as that is the foundation for the delimitation exercise. Sample this:
The Discrepancies in 2011 Population Data
Unusual patterns in population growth have been registered in some areas. After a sharp increase in population between 1981 and 2001, the dip in population too has been equally unprecedented as per 2011 figures. The population growth data in some of the villages of Ganderbal in Kashmir shows very unnatural growth patterns. In village Barwalah, for instance, the population growth from 1981 to 2001 is 163.51 per cent, but in the same village, the population growth between 2001 and 2011 is merely 8.85 per cent.
Another example is the Forest Block where, between 1981 and 2001, the population growth was 728.2 per cent, however in the next decade, between 2001 and 2011, it came down to 23.1 per cent. Similar is the example of Gund Momim, where the population growth between 1981 and 2001 was 983.1 per cent, but in the next decade, instead of the population going up, it falls by -17.35 per cent!
District Pulwama
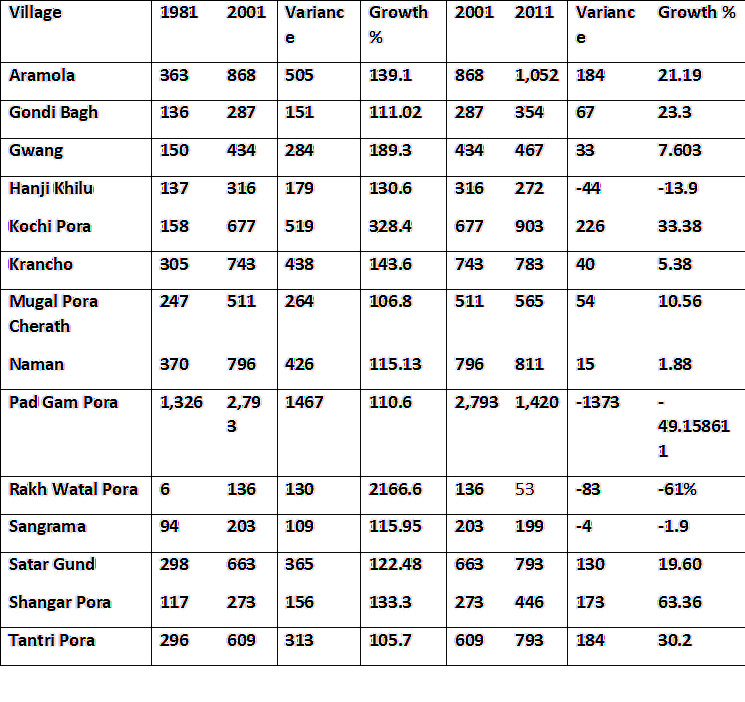
Table 1- Population growth data of District Pulwama, Source: Census Reports
In Table 1, population data of some villages in Pulwama district is provided. If we observe the growth pattern in these villages, we notice that in Gwang village, the population growth registered between 1981 and 2001 is 189.3 per cent, which dramatically drops to 7.603 per cent in the next decade.
Similarly, in Kochi Pora, in the same duration of 20 years, the population goes up by 328.4 per cent but in the next decade, it grows at 33.38 per cent only.
The example of Pad Gam Pora will not be out of place, where in two decades, 1981 to 2001, the population growth is shown at 110.6 per cent, however in the next decade, it has dropped to -49.19 per cent.
In Rakh Watal Pora, where the registered population growth between 1981 and 2001 was 2166.6 per cent, in the next decade, it dipped to -61 per cent.
As it is evident, there is unusual growth pattern in some villages of Kashmir valley between 1981 and 2011 and this is one of the major concerns. An important point to note here is that no census was conducted in 1991, so from unprecedented growth between 1981 and 2001, the graph came down drastically between 2001 and 2011. Let us also not forget that the period between 1988 and 1992 saw the Kashmir Hindu exodus with more than 4 lakh families moving out of Kashmir and seeking refuge in Jammu and other parts of India. It is also noteworthy that terrorism was at its peak in Jammu and Kashmir in the same duration.
This clearly points to possible tampering of data to engineer a balancing act.
To further underline the discrepancies in population data, the following may be considered:
Checking the voters list to verify population data
Considering the glaring inconsistencies in population data, it would be important to verify the voters’ data which also indicates irregularities. For example, this:
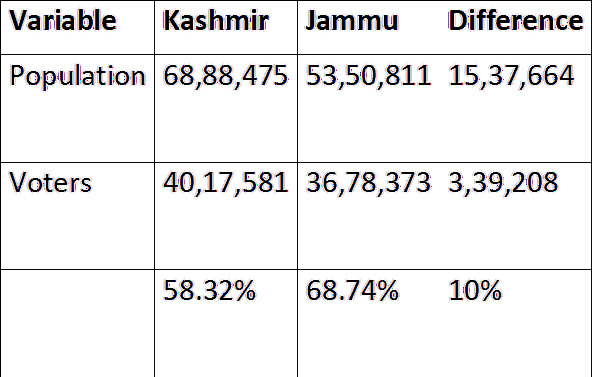
Table 2- Data showing population and voters’ difference, Source: State Election Commission & Census 2011
The population data of the 2011 Census as evident in Table 2 has problems. In the 2011 Census, the population of Kashmir division is shown to be 68,88,475, whereas the number of voters is just 40,17,581; on the other hand, the population of Jammu division, as per the census, is 53,50,811, whereas number of voters is 36,78,373. Thus, the population difference between two regions is 15,37,664 but the voters’ difference is just 3,39,208! This does not appear to be a normal trend.
Generally, the voters, i.e. the adult population, constitute about 60 to 80 per cent of the total population of a constituency. Thus, the population-voter ratio of Jammu division is as per the national trend, whereas in Kashmir division, the population-voter ratio is unusual. This clearly indicates tampering with the population data of the two regions. The population of one area seems to have been inflated while the population of another area seems to have been reduced. Hence, even though the population of Kashmir division is large, voters are less. Even when we look at this district-wise, we will find that the population and voters ratio is disturbed in Anantnag, Kupwara and Srinagar in Kashmir division. This needs to be thoroughly investigated.
Further, the population-voter ratio in some districts is very unusual. The population-voter ratio in three districts of Kashmir division—Anantnag with 49 per cent, Srinagar with 51 per cent, Kupwara with 53 per cent—and from Jammu division Doda with 52 per cent, are examples of the unusual pattern. In other words, the number of voters is half the number of people living in these districts. How can this be even possible that almost 50 per cent population in these districts consists of people below the age of 18 years? On the other hand, some other districts have the population-voter ratio at 60-80 per cent or more. This table makes it clear that the registered population figures in the Census may be inaccurate.
The Discrepancies in Voters’ Records
There are flaws in the voters’ numbers as well. Below is a table containing voter numbers and percentage from five Lok Sabha seats in the UT of J&K:
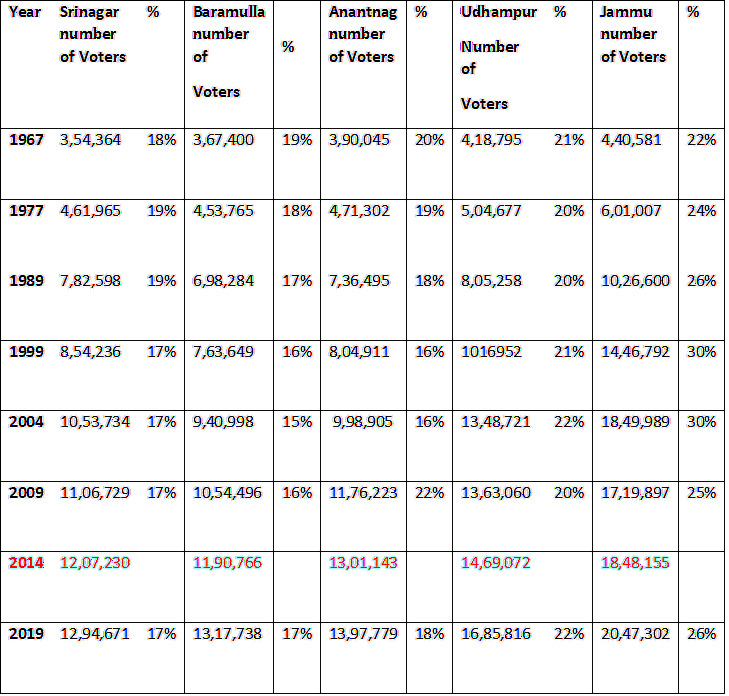
Table 3 – Comparison of number of voters and percentage in Lok Sabha constituencies over the years, Source: State Election Commission
In Table 3, the percentage of voters in Srinagar is shown as almost constant, between 17 to 19 per cent, right from 1967 to 2019, whereas in the same period, the percentage of voters in Jammu has been oscillating from 22 per cent to 30 per cent. It is also noteworthy that between 2004 and 2009, the number of voters in Jammu has gone down by almost 1,30,092 voters.
How is it that in a span of five years the number of voters in Jammu Lok Sabha seat, which comprises Jammu, Samba, Poonch and Rajouri, suddenly went down. How did the population in all these areas instead of increasing kept decreasing?
Another relevant example is the Udhampur Lok Sabha constituency from Jammu division, covering almost 45 per cent of land area of the five Lok Sabha seats. In Table 3, we can see that in Udhampur, between 2004 and 2009, the number of voters went up by just 14,339 voters.
As against these, between 2004 and 2009, in the Lok Sabha seats of Kashmir division, the numbers of voters increased in Srinagar by 52,995 and in Baramulla by 1,13,498. In Anantnag, from Kashmir division, the voters’ numbers went up by more than by 1,77,318. There is no reason for a sudden reduction of more than 1.3 lakh voters in Jammu and a contrasting increase in Anantnag. This increase in voter numbers in Kashmir division and reduction of the same in Jammu division deserves further scrutiny. The possibility of intentional tampering of data to meet the interest of a particular section of the society cannot be ignored.
Let us now test the data with Aadhaar Cards issued
Aadhaar cards are a reliable yardstick to test population records. Based on the 2011 Census, Aadhaar cards were issued in all states across India and in most states, about 92-98 per cent population has received Aadhaar cards and in some places, the coverage is almost 100 per cent. As per the records of 2011, the population of Jammu and Kashmir was around 1.25 million (12. 50 lakh), and as per the records till 2020, the projected population (as on May 2021) of Union Territory of Jammu and Kashmir is 1,36,06,320, of which 1,07,97,544 have been issued Aadhaar cards, i.e. 79.36 per cent of the population (till December 31, 2020).
Since many years now, Aadhaar is mandatory for everything. To avail benefits of any scheme, for admissions in educational institutions, to get any license, a gas connection, to open bank accounts, for everything we need Aadhaar. Despite this compulsion, a large population of Jammu and Kashmir is shown as without Aadhaar. If we compare Jammu and Kashmir with two other hilly states, Himachal Pradesh and Uttarakhand, we will find that although in Himachal and Uttarakhand only the 0 to 5 year age group has lower number of Aadhaar cards issued and other age groups have largely been issued the card, in Jammu and Kashmir, the number is lower than these two states in all categories. There is no particular reason for this disparity between the two states and the UT; hence, this once again raises doubts on the accuracy of population data of Jammu and Kashmir.
Let us compare total population as per 2011 Census, projected population in 2020 and the population with Aadhaar cards in 2021. The population of Srinagar, as per data in 2011, is 12,36,829 and the number of issued Aadhaar cards is 8,80,903. Even in case of Anantnag and Kupwara, it is the same irregularity. But if we look at the figures of Poonch and Jammu division, as per the Aadhaar records, a large population has been covered in 2021. The gap between population and Aadhaar cards issued in 2021 is marginal in these two districts. If Poonch and Jammu could get Aadhaar cards issued covering the entire population of 2011 and many more, then why did the same not happen in Srinagar, Anantnag and Kupwara?
Another significant aspect to be noted here is that the terrain in Jammu comprises much larger hilly areas than the Kashmir division. If despite the lack of easy access to areas in Jammu division, Aadhaar cards were issued to people, why was the same not done in Kashmir division?
To get correct population data, the voter lists of 2019 and Aadhaar should also be considered. And this exact estimation of population, based on data collected from various sources, should be used for delimitation. There are also serious anomalies in the geographical description and distribution in Kashmir districts, which can be verified through a ground study by the Surveyor General of India.
The Delimitation Commission is out to set right a historical wrong. To base that on flawed data that has been engineered to ensure a Srinagar-centric narrative will be a disservice to the spirit of the whole exercise. If the foundation is flawed, the structure will be compromised. Hence, the need for a rethink.
Read all the Latest News , Breaking News and IPL 2022 Live Updates here.




Comments
0 comment