views
- Click your graph to select it, and then click + in its top-right corner.
- Check the box next to Axis Titles to make text boxes appear on each axis.
- Select an "Axis Title" text box and edit its text.
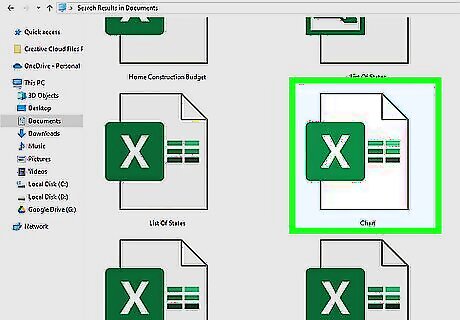
Open your Excel document. Double-click an Excel document that contains a graph. If you haven't yet created the document, open Excel and click Blank workbook, then create your graph before continuing.
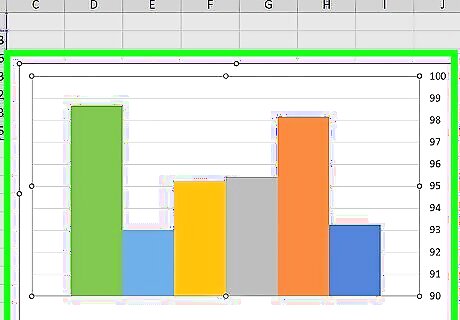
Select the graph. Click your graph to select it.
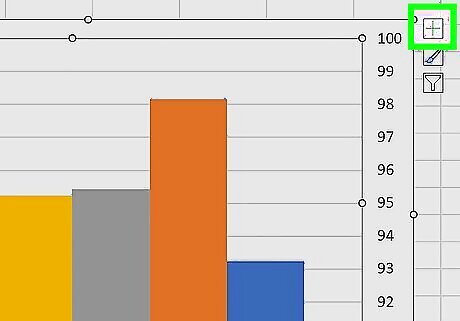
Click +. It's to the right of the top-right corner of the graph. This will open a drop-down menu.
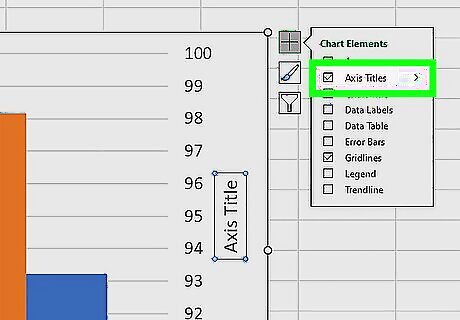
Click the Axis Titles checkbox. It's near the top of the drop-down menu. Doing so checks the Axis Titles box and places text boxes next to the vertical axis and below the horizontal axis. If there is already a check in the Axis Titles box, uncheck and then re-check the box to force the axes' text boxes to appear.
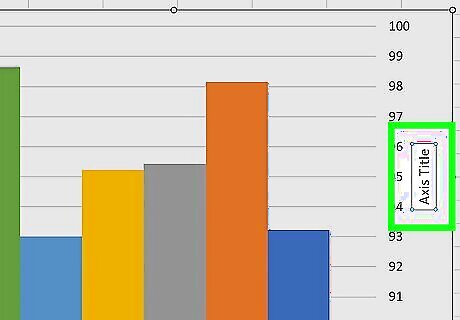
Select an "Axis Title" box. Click either of the "Axis Title" boxes to place your mouse cursor in it.
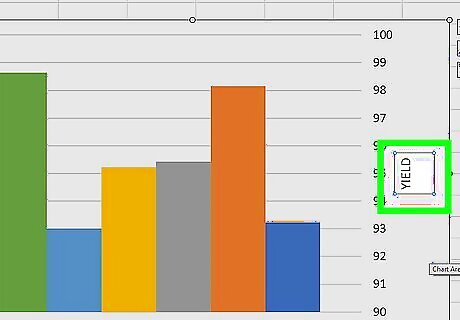
Enter a title for the axis. Select the "Axis Title" text, type in a new label for the axis, and then click the graph. This will save your title. You can repeat this process for the other axis title.


Comments
0 comment